Forecasting plays a pivotal role in managing businesses, and the comparison between projected and actual outcomes holds immense importance in project management. Utilizing an effective tool or dashboard to calculate the variance between the projected and actual results becomes essential. In this guide, we’ll delve into comparing forecasted and actual data in Excel using formulas.
Excel Calculation for Variance Between Forecast and Actual Data
The Generic Formula for Variance in Forecast and Actual:
Variance = ACTUAL – FORECAST
ACTUAL: Represents the gathered actual data or amount. FORECAST: Denotes the forecasted data or amount.
This calculation simply subtracts the forecast from the actual, assuming the actual to be higher than the forecast. However, it can work oppositely if you anticipate the actual to be lower than the forecast.
Let’s take an example to create a variance report in Excel: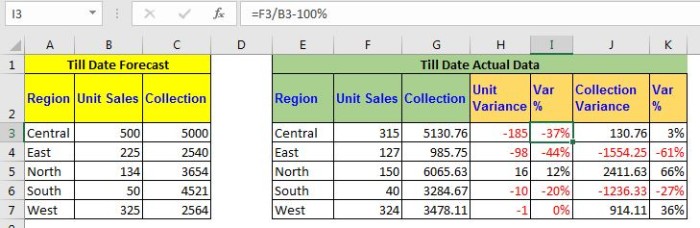
Consider a scenario with sales data for stationery products across different months. Using Excel forecast formulas, we’ve projected sales and unit production to date. As the months progress, we’ve accumulated actual sales and production data in Excel. Now, we aim to generate a report showcasing the variance between actual and forecasted reports.
We’ll simply subtract the forecasted data from the actual data:
Use this formula in cell H2 and drag it down (for this example):
= F3 – B3
This computes the difference between Actual and Forecast unit variances. A positive difference signifies the actual value exceeding the forecasted one, whereas a negative difference implies the opposite.
Similarly, apply this formula in J2 to obtain the collection variance:
= G3 – C3
This calculates the variance in collection.
To obtain the percentage variance of units and collection, employ these Excel formulas:
= (F3 / B3) – 100% = (G3 / C3) – 100%
A negative percentage indicates a negative variance, while a positive percentage signifies a positive variance.
I’ve used conditional formatting in this column to highlight negative values with red text.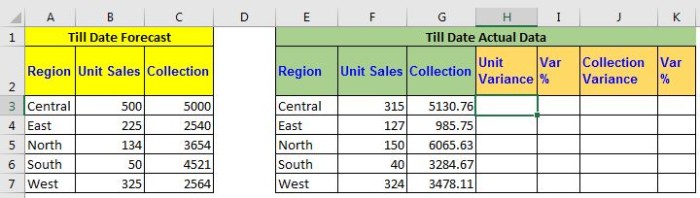
This method streamlines the creation of reports based on actual versus forecasted data, simplifying analysis and aiding in decision-making. If you need specific guidance on forecasting formulas in Excel or any other Excel-related query, feel free to ask in the comments section below.