Calculating Actual vs Forecast Variance. Forecasting plays a pivotal role in business management, with comparing actual versus forecasted outcomes being a crucial aspect of project assessment. Constructing a proficient tool or dashboard within Excel to compute these variances is indispensable. This guide delineates the process of comparing forecasted and actual data using Excel formulas.
Excel Guide: Calculating Actual vs Forecast Variance
Fundamental Formula for Variance Calculation:
=ACTUAL - FORECAST
Explanation:
ACTUAL: Represents the gathered or observed data.FORECAST: Denotes the anticipated or predicted data.
Typically, subtracting the forecast from the actual yields a positive result, assuming the actual is higher than the forecast. However, this can be reversed if the expectation is for the actual to be lower than the forecast.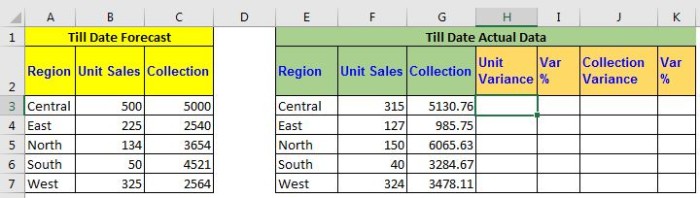
Illustrative Example: Generating a Forecast vs Target Report with Excel Variance
Consider a dataset detailing sales of stationery items across various months. Initially forecasting sales and unit production, as the months progress, actual sales and production data are collected. Creating a report showcasing the variance between these actual and forecasted figures is the aim.
Utilize the following formulas in Excel:
For unit variance (difference between actual and forecast):
=F3 - B3
This formula in cell H2 computes the variance. Drag it downwards for further data entries.
Similarly, for collection variance:
=G3 - C3
This evaluates the variance in collections.
To derive percentage variance for units and collection, apply these Excel formulas:
For units:
=(F3 / B3) - 100%
For collections:
=(G3 / C3) - 100%
A negative percentage indicates negative variance, while a positive percentage signifies positive variance. You can enhance readability by employing conditional formatting to highlight negative variances in red text.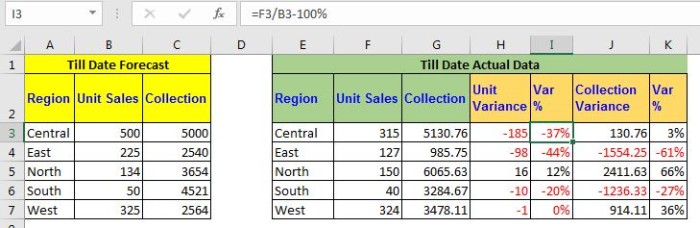
Empowering Reports on Actual vs Forecasted Data
Calculating Actual vs Forecast Variance. By creating these reports, the analysis becomes streamlined, facilitating informed decision-making. For more insights or specific queries regarding forecasting formulas in Excel or any other related Excel queries, feel free to inquire in the comments section below.