In the realm of statistics, the Interquartile Range (IQR) emerges as a powerful tool, serving to identify outliers and unveil the distribution of the middle 50% of a dataset.
Excel IQR Calculation: Unveiling Data Insights
The IQR provides a robust analysis of data, resilient to the influence of outliers and extreme values. This grants a clearer perspective on data variability compared to metrics like range or standard deviation.
While Excel lacks a dedicated formula for IQR,Calculation it offers a Quartile formula that seamlessly adapts to compute the IQR.
But before delving into the Excel calculation, let’s demystify the concept of quartiles and understand how they pave the way for IQR Calculation.
Quartiles and Interquartile Range Demystified:
In statistics, a dataset or population can be segmented into four quartiles denoted as Q1, Q2, Q3, and Q4.
Imagine a dataset of ascending-order scores, such as the students’ test scores: 0, 1, 2, 3, 4, 5, 6, 7, 8, 9, 10. The first quartile (Q1) of this dataset would be 2.5, indicating that scoring 2.5 or below places you in the bottom 25%.
Similarly, Q2 is 5, Q3 is 7.5, and Q4 is 10. The IQR is then calculated as follows:
IQR = Quartile 3 – Quartile 1
For our example, IQR equals 7.5 – 2.5.
Calculating Interquartile Range (IQR) in Excel:
While Excel doesn’t offer a dedicated IQR Calculation function, it provides the Quartile function. Here’s a step-by-step guide: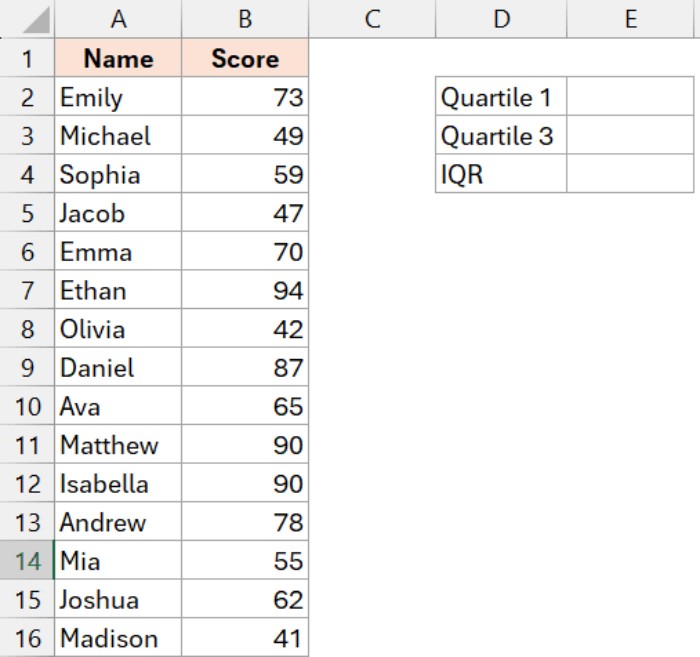
- Calculate Quartile 1 (Q1) in cell E2:
=QUARTILE.INC(B2:B16,1)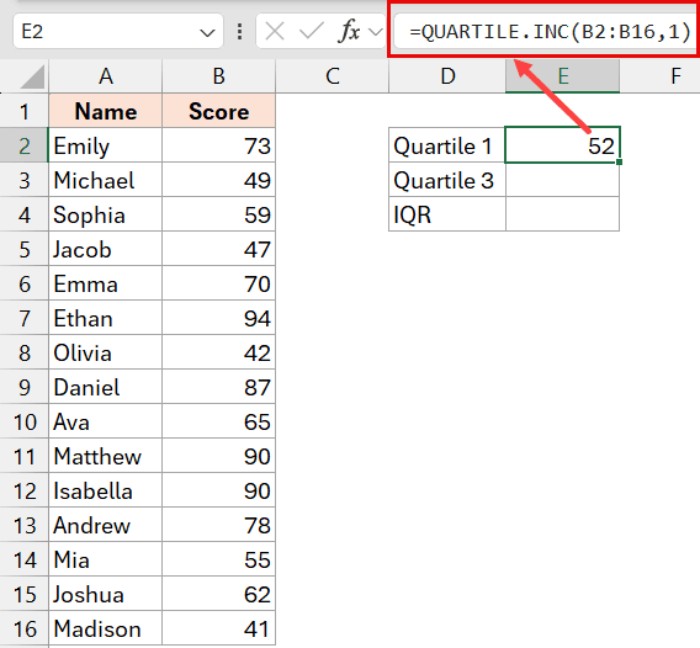
- Calculate Quartile 3 (Q3) in cell E3:
=QUARTILE.INC(B2:B16,3)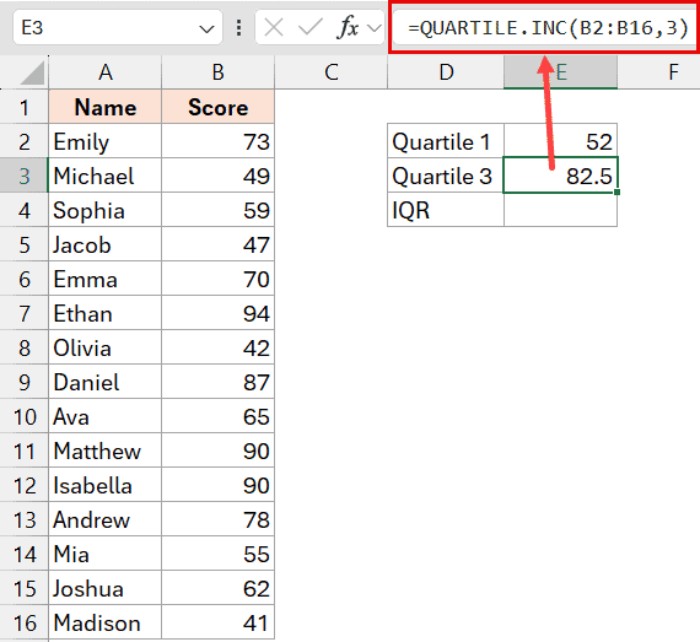
- Compute IQR in cell E4:
=E3-E2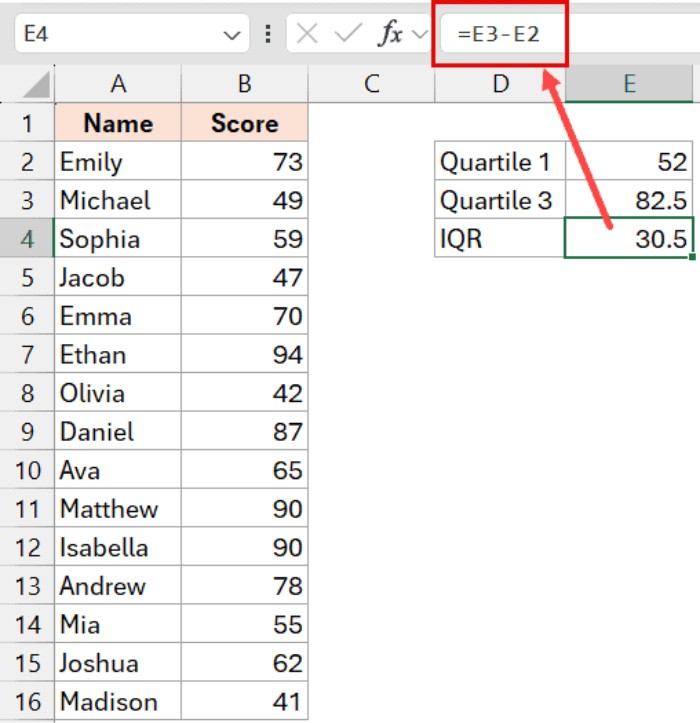
Alternatively, you can use a single formula:
=QUARTILE.INC(B2:B16,3)-QUARTILE.INC(B2:B16,1)
Excel offers three Quartile functions—QUARTILE, QUARTILE.INC, and QUARTILE.EXC. Prefer QUARTILE.INC, which includes 0 and 100 percentile values, ensuring accurate calculations.
Interpreting the IQR Calculation Value:
The IQR Calculation sheds light on the spread of the middle 50% of your data, encompassing the range between the 25th and 75th percentile values.
- A high IQR signifies substantial spread among middle data points.
- A low IQR indicates proximity among these points.
Consider students’ scores: a low IQR implies consistent scoring, while a high IQR suggests significant variability.
To best represent IQR in Excel, utilize Box Plots charts, providing a visual depiction of data distribution based on quartiles.
IQR*1.5 Rule for Identifying Outliers:
A 1.5*IQR rule helps pinpoint outliers—values falling below Q1 – 1.5 * IQR or above Q3 + 1.5 * IQR. This proves invaluable for managing large datasets and outlier identification.
In conclusion, this guide empowers you to wield a straightforward formula for calculating the Interquartile Range (IQR) in Microsoft Excel, enriching your statistical prowess.