The Coefficient of Variation (CV) serves as a crucial statistical metric, providing insights into the variability inherent in a given dataset. Although Excel lacks a built-in formula specifically for the coefficient of variation, you can effortlessly compute it by first determining the mean and standard deviation separately, and then using these values to calculate the coefficient of variation.
In this brief tutorial, I’ll guide you through the process of calculating the coefficient of variation in Excel using a straightforward dataset.
Understanding the Coefficient of Variation
The Coefficient of Variation, expressed as a percentage, gauges the degree of variation within a dataset. A high CV suggests significant variability compared to the dataset’s mean, signifying that some values deviate substantially from the mean. Conversely, a low CV indicates limited variation, with most values closely clustered around the mean.
For instance, in a dataset of students’ heights, a high CV implies diverse height ranges, while a low CV signifies uniform heights close to the mean.
Step-by-Step Calculation of Coefficient of Variation
Consider a dataset of students’ heights as an example:
Dataset:
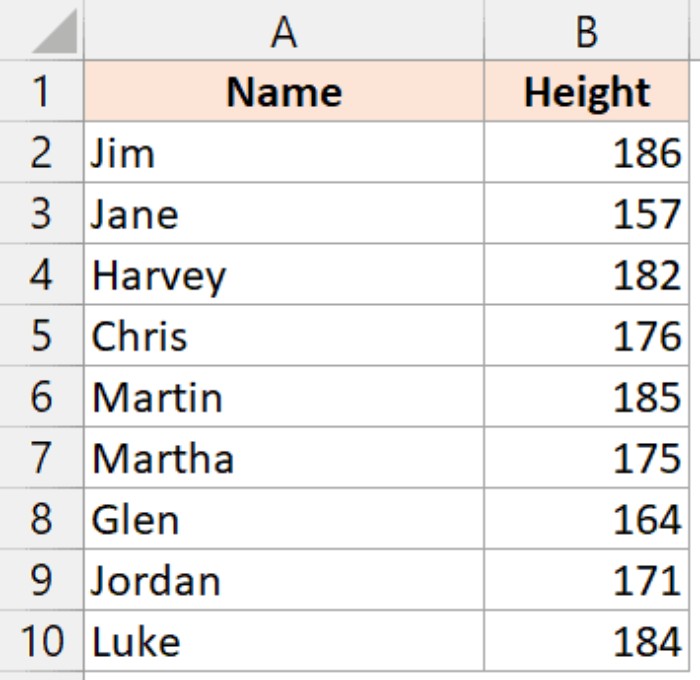
Step 1 – Calculate the Mean of the Dataset: Use the AVERAGE function in Excel to find the mean:
=AVERAGE(B2:B10)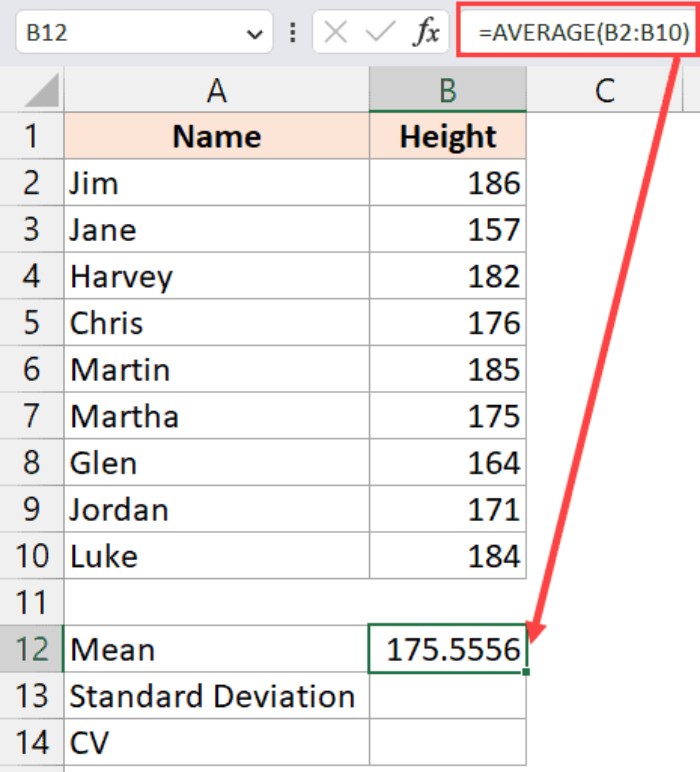
Step 2 – Calculate the Standard Deviation of the Dataset: Employ the STDEV.P function for the entire population standard deviation:
=STDEV.P(B2:B10)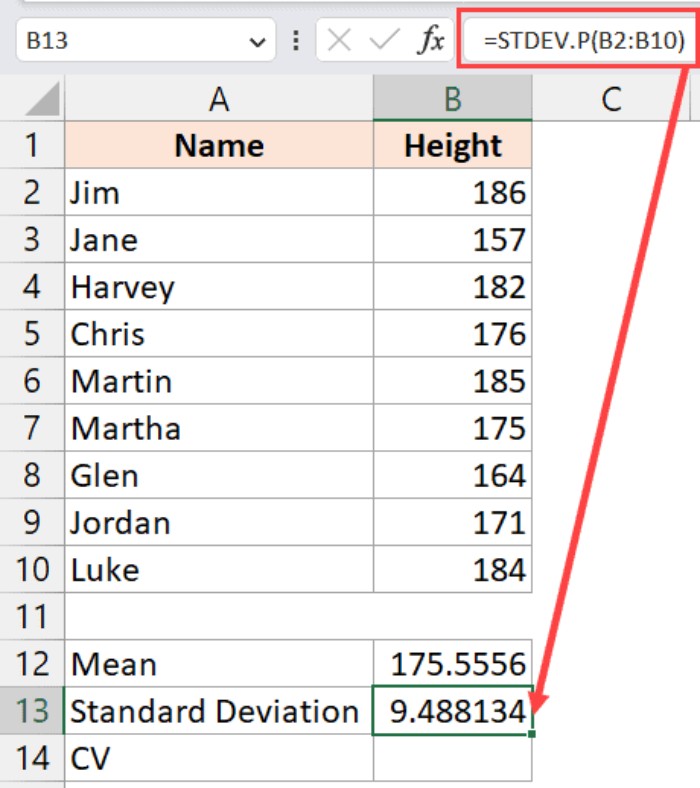
Step 3 – Calculate the Coefficient of Variation: Determine the coefficient of variation by dividing the standard deviation by the mean:
=(B13/B12)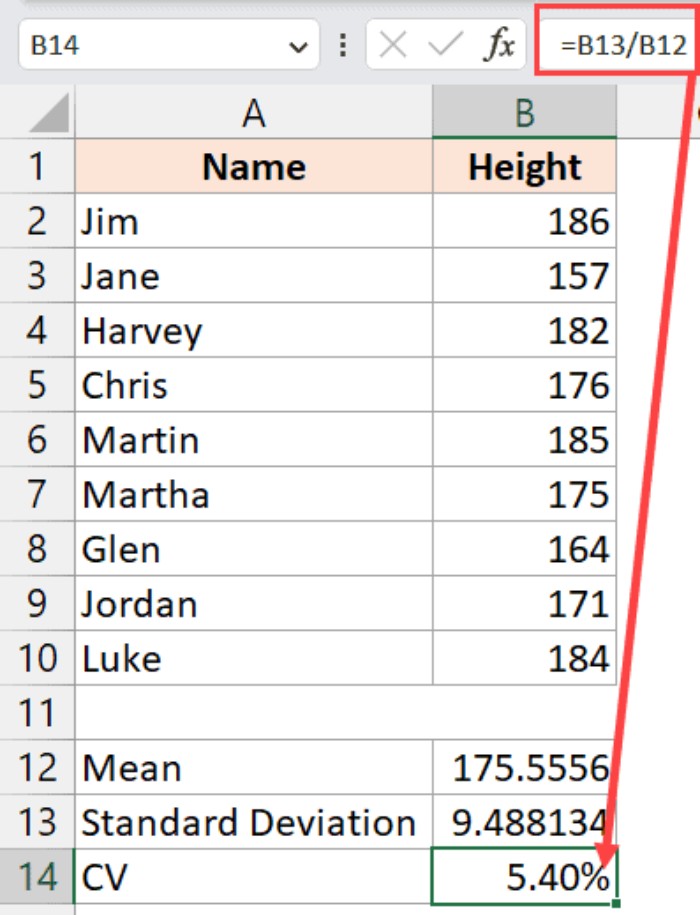
If the coefficient of variation appears as a decimal, convert it to a percentage by selecting the cell, navigating to the Home tab, and clicking on the percentage icon in the Number group.
Alternatively, streamline the calculation by using a single formula:
=STDEV.P(B2:B10)/AVERAGE(B2:B10)
Coefficient of Variation for Population vs. Sample
When calculating standard deviation (Step 2), choose between STDEV.P and STDEV.S based on whether your dataset represents an entire population or a sample. STDEV.P is suitable for population data, providing more accurate results, while STDEV.S is ideal for sample data, offering slightly less accuracy as it pertains to a subset of the population.
In conclusion, this tutorial illustrated, involving the use of mean and standard deviation, both easily obtainable through Excel’s built-in functions.


